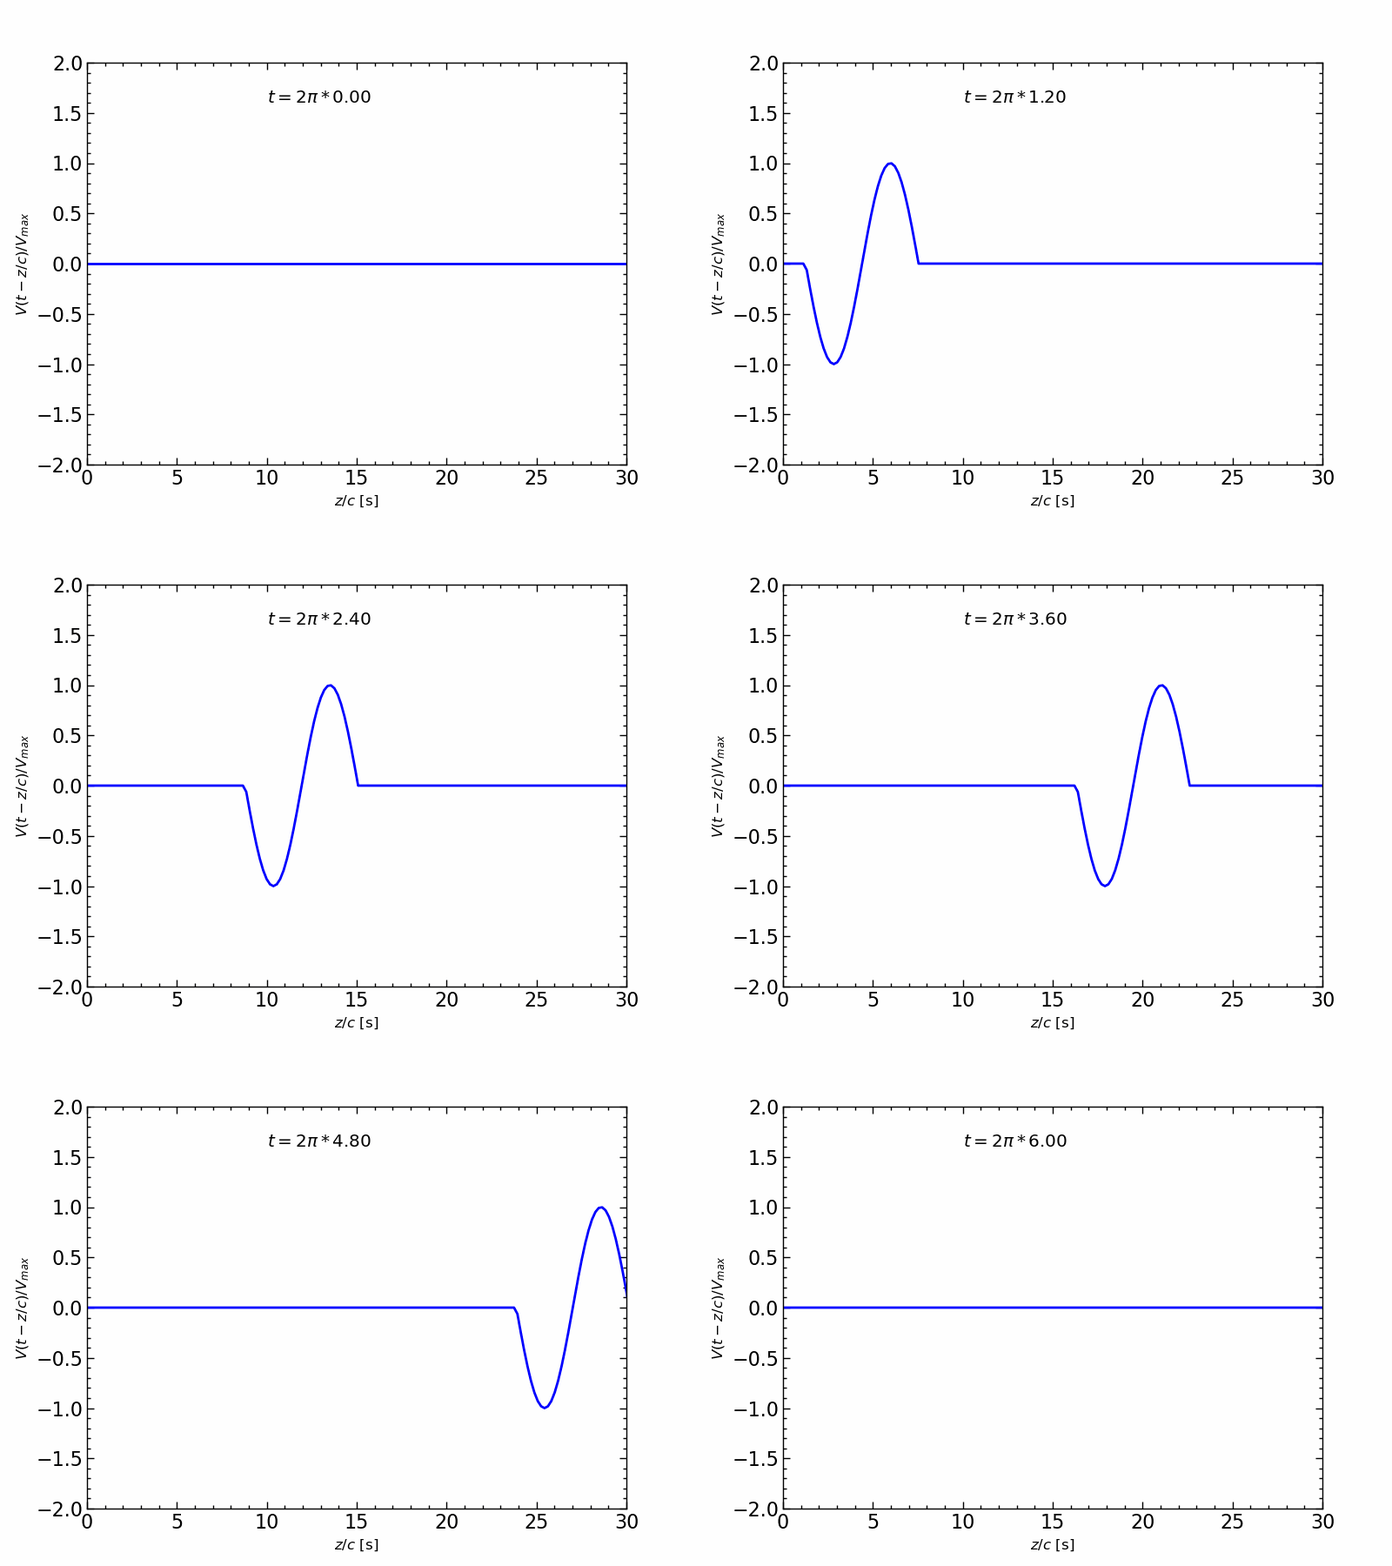
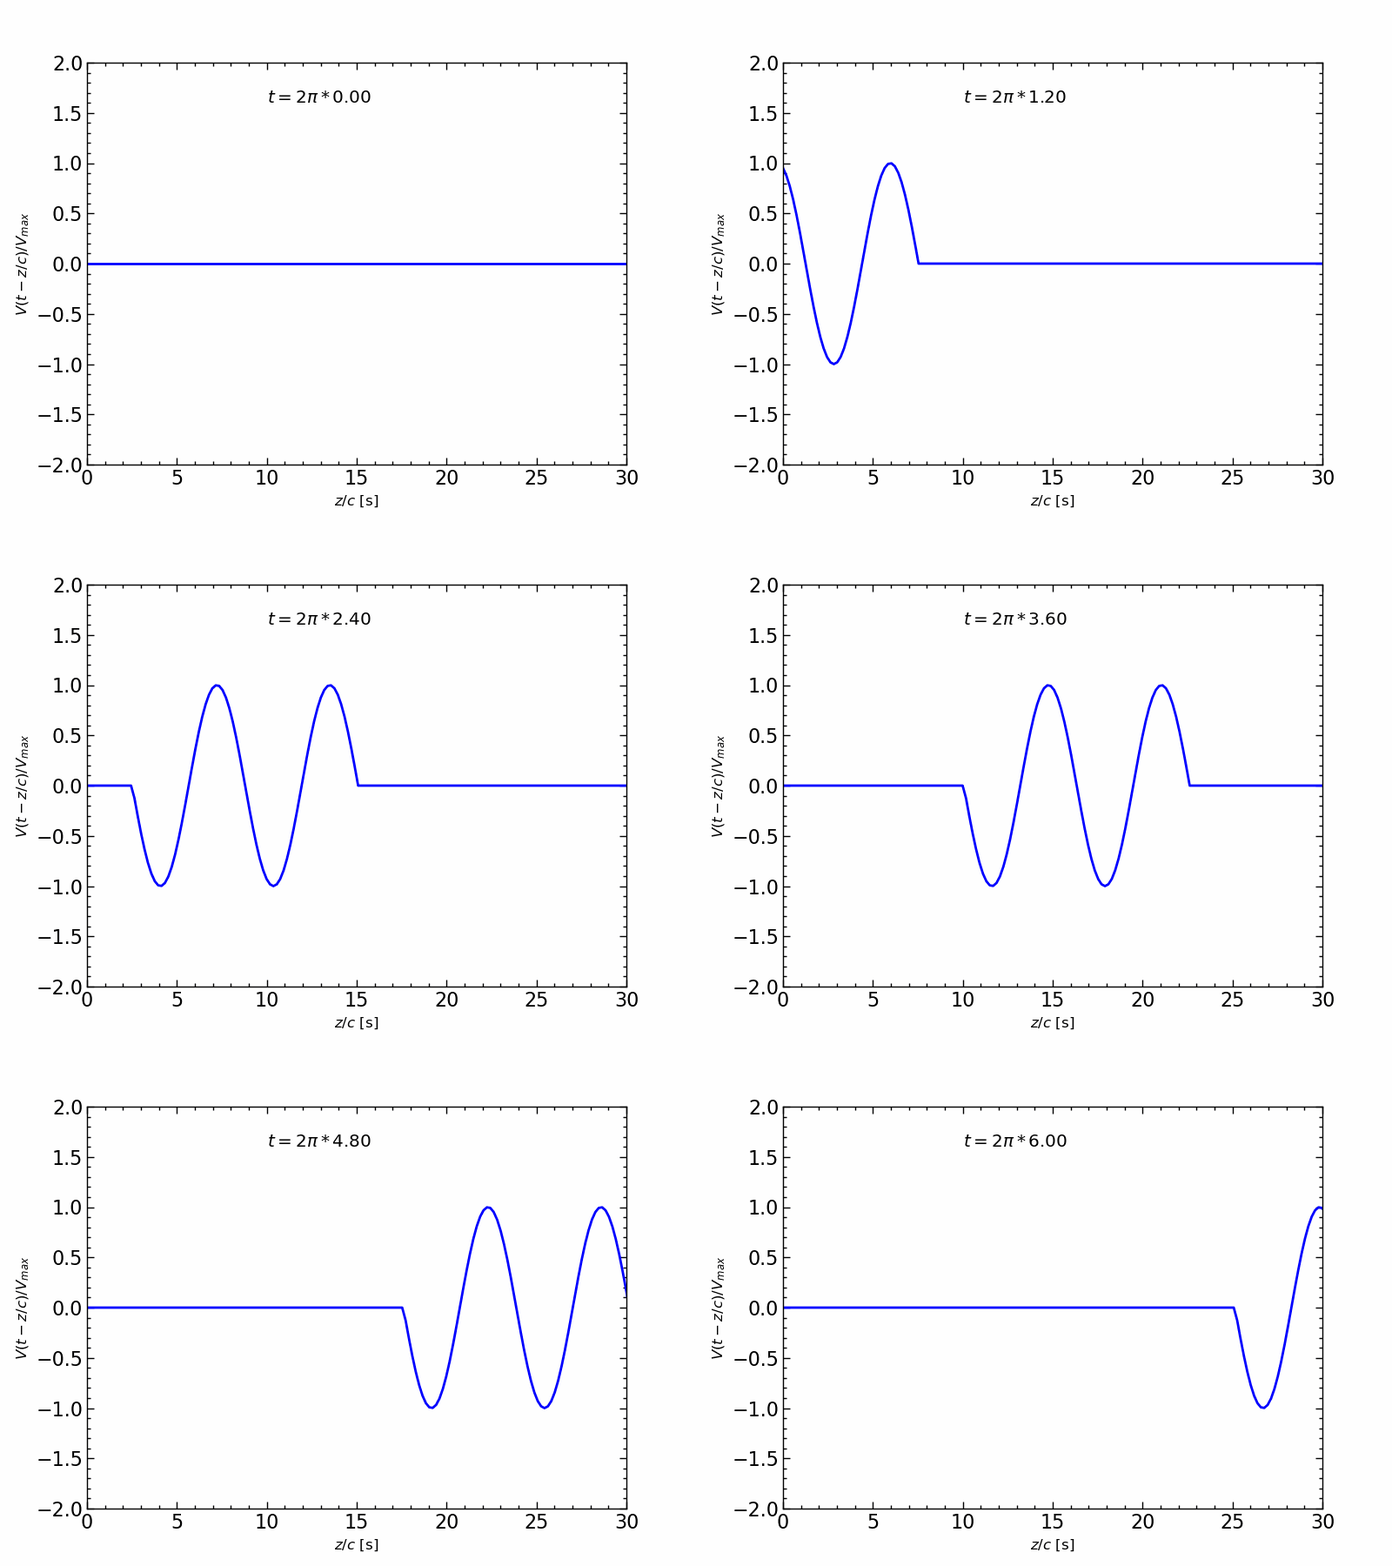
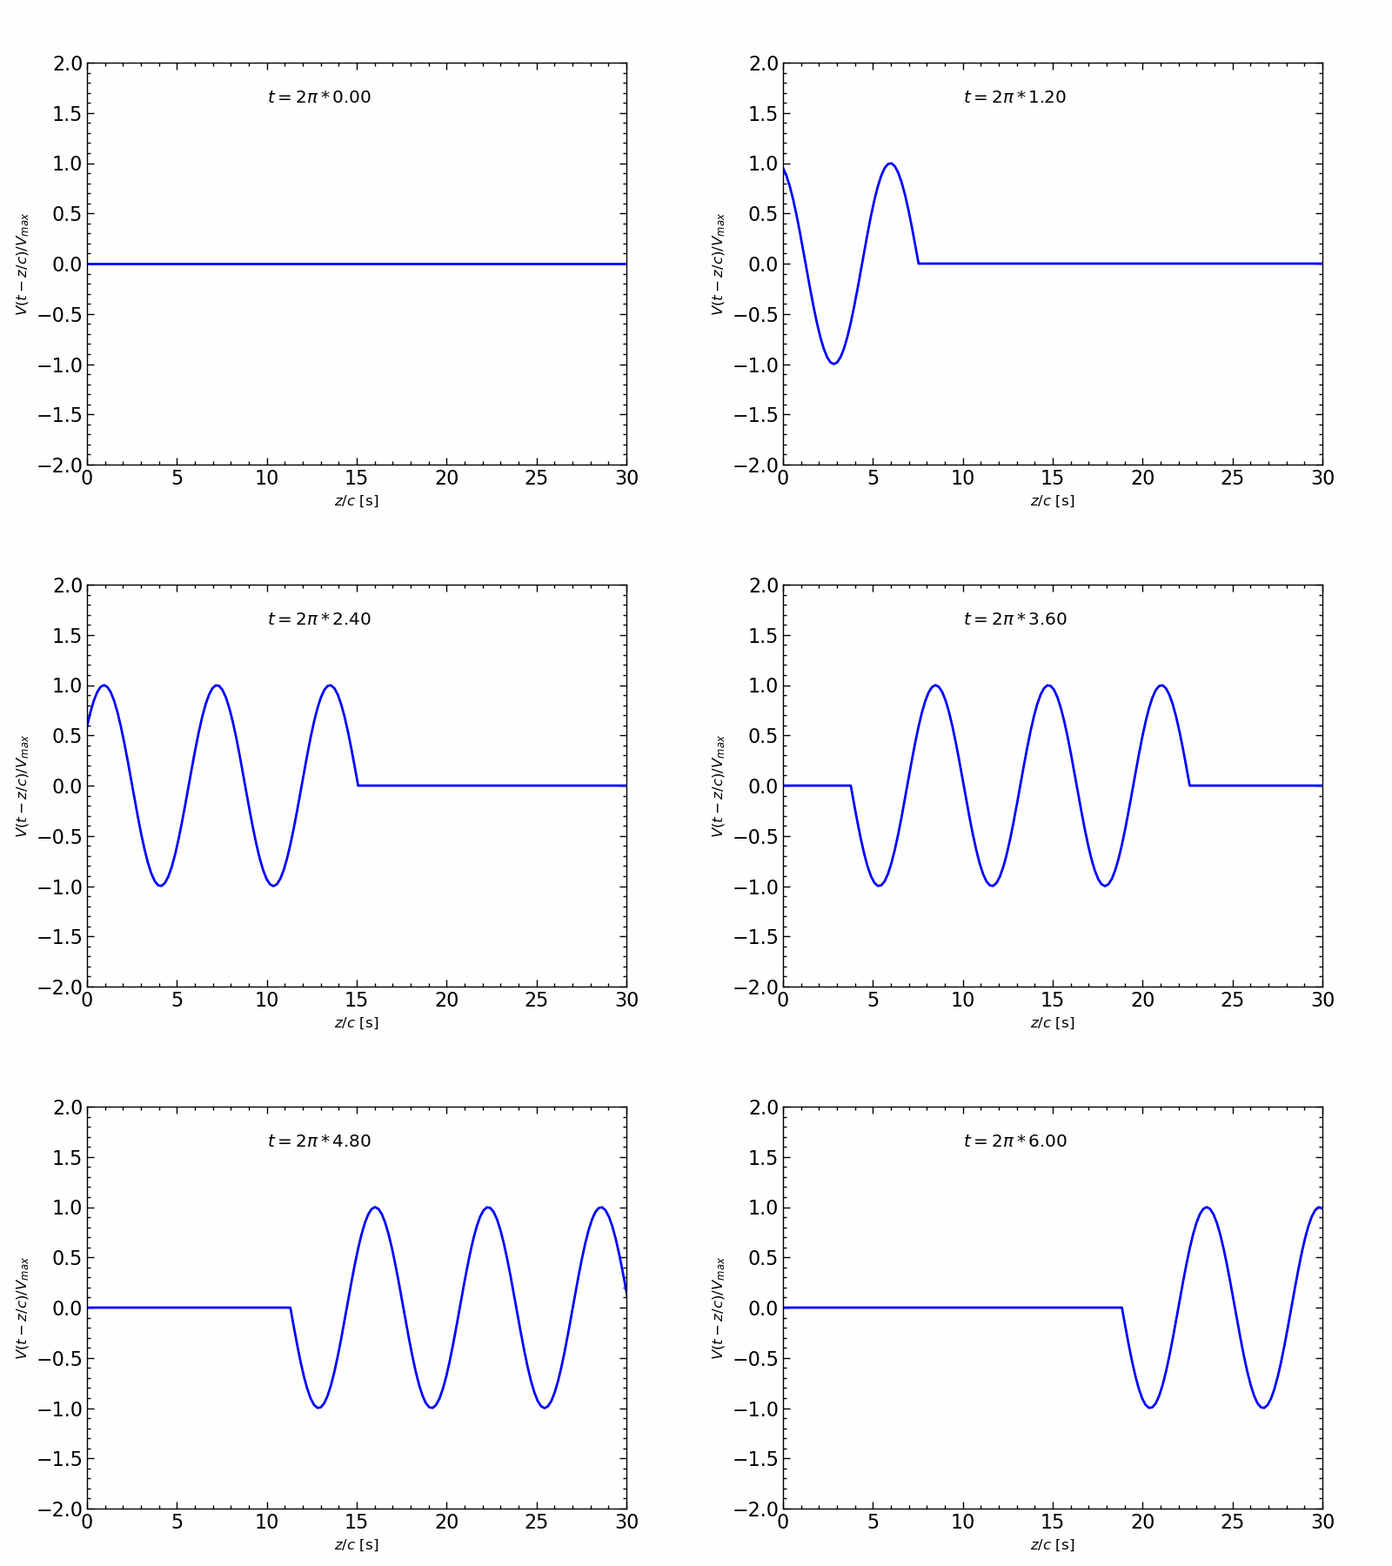
波形の伝送アニメーション
モジュールのインポート
import numpy as np
from matplotlib import pyplot as plt
from matplotlib.animation import ArtistAnimation
import scienceplots
#Warning : As of version 2.0.0, you need to add import scienceplots before setting the style (plt.style.use('science')).
plt.style.use(['science', 'notebook'])
波形のユーザ関数
def funcv(t,zc): # 関数の定義
    return np.sin(t-zc)
アニメーション
1周期の正弦波信号の伝送を,$z/c$ の関数とし,時間 $t$ を変化させたアニメーションは,
fig, ax = plt.subplots() # グラフ領域の作成

# グラフ要素のリスト(artists)作成
artists = []
pi2 = 2.0*np.pi
n = 201
t_min, t_max = 0.0, 6.0*pi2
zc_min, zc_max = 0.0, 6.0*pi2
zc = np.linspace(zc_min, zc_max, n)
y = np.zeros(n)
dt = (t_max-t_min)/float(n-1)
tt = np.empty(0)
yy = np.empty((0,n))
nT = 1.0 # 伝送する正弦波信号の周期
for i in range(n):
    t = t_min+i*dt
    alpha = t-zc
    x1 = alpha >= 0.0 # 信号の範囲
    x2 = alpha <= pi2*nT # 信号の範囲
    x3 = np.logical_and(x1, x2)
    y = np.where(x3, funcv(t,zc), 0.0)
    tpi2 = t/pi2
    my_title = ax.text(10.0, 1.6, f"$t=2\pi*${tpi2:.2f}", size="x-large")
    my_line, = ax.plot(zc, y,"blue")
    artists.append([my_line, my_title]) #  アニメーション化する要素をリスト化
    tt = np.append(tt, t)
    yy = np.append(yy, [y], axis=0)
yyt = np.transpose(yy)

# アニメーション化
ax.set_xlim(0, 30) # x軸範囲の設定
ax.set_ylim(-2, 2) # y軸範囲の設定
ax.set_xlabel("$z/c$ [s]", size="large") # x軸のラベル設定
ax.set_ylabel("$V(t-z/c) / V_{max}$", size="large") # y軸のラベル設定
anim = ArtistAnimation(fig, artists, interval=10)
anim.save("animation_sin_z_1T.gif", writer="pillow")
plt.show()
nd = 25
np.set_printoptions(suppress=True, precision=3, floatmode='fixed')
yy3 = yyt[0:n:nd,0:n:nd]
print(yy3)
[[ 0.000 -1.000  0.000  0.000  0.000  0.000  0.000  0.000  0.000]
 [ 0.000  0.000 -1.000  0.000  0.000  0.000  0.000  0.000  0.000]
 [ 0.000  0.000  0.000 -1.000  0.000  0.000  0.000  0.000  0.000]
 [ 0.000  0.000  0.000  0.000 -1.000  0.000  0.000  0.000  0.000]
 [ 0.000  0.000  0.000  0.000  0.000 -1.000  0.000  0.000  0.000]
 [ 0.000  0.000  0.000  0.000  0.000  0.000 -1.000  0.000  0.000]
 [ 0.000  0.000  0.000  0.000  0.000  0.000  0.000 -1.000  0.000]
 [ 0.000  0.000  0.000  0.000  0.000  0.000  0.000  0.000 -1.000]
 [ 0.000  0.000  0.000  0.000  0.000  0.000  0.000  0.000  0.000]]
また,変数も一緒に出力すると,
print("sin (t - z/c)")
print(f"{' z/c':>10s}",end=' ')
[print(f"{zc[j]/np.pi:6.3f}",end=' ') for j in range(0,n,nd)]
print('')
print(f"{'i':>3s}{' t':>7s}",end=' ')
print('')
for i in range(0,n,nd):
    print(f'{i+1:3d}',end=' ')
    print(f'{tt[i]/np.pi:6.3f}',end=' ')
    for j in range(0,n,nd):
        print(f'{yyt[i,j]:6.3f}',end=' ')
    print('')
sin (t - z/c)
       z/c  0.000  1.500  3.000  4.500  6.000  7.500  9.000 10.500 12.000
  i      t
  1  0.000  0.000 -1.000  0.000  0.000  0.000  0.000  0.000  0.000  0.000
 26  1.500  0.000  0.000 -1.000  0.000  0.000  0.000  0.000  0.000  0.000
 51  3.000  0.000  0.000  0.000 -1.000  0.000  0.000  0.000  0.000  0.000
 76  4.500  0.000  0.000  0.000  0.000 -1.000  0.000  0.000  0.000  0.000
101  6.000  0.000  0.000  0.000  0.000  0.000 -1.000  0.000  0.000  0.000
126  7.500  0.000  0.000  0.000  0.000  0.000  0.000 -1.000  0.000  0.000
151  9.000  0.000  0.000  0.000  0.000  0.000  0.000  0.000 -1.000  0.000
176 10.500  0.000  0.000  0.000  0.000  0.000  0.000  0.000  0.000 -1.000
201 12.000  0.000  0.000  0.000  0.000  0.000  0.000  0.000  0.000  0.000
前のページに戻る
「目次」のページに戻る


